
Building a modern analytics pipeline for Tableau Public with dlt, dbt, and DuckDB
At the outset of the pandemic, I first wrote about another crisis in motion: the cratering of newspaper jobs in Maine, where I spent most of my journalism career.
Since that writing, many times when a story pops about Maine’s newspaper industry and its challenges, I’ll get an email about those numbers and where the most recent figures might be found.
This is probably the most limited use case for building a robust and lightweight analysis pipeline for data from the U.S. Bureau of Labor Statistics’ Quarterly Census of Employment and Wages, but it is my immediate use case and a good sample problem.
The result is a pipeline that demonstrates how modern data tools can work together to serve both rigorous data engineering practices and public-facing visualizations through Tableau Public.
To start, I’ll focus on the visualizations themselves. Skip ahead for details on the how-to (which, full disclosure, Claude helped me write based on the Github README that I wrote with my own brain).
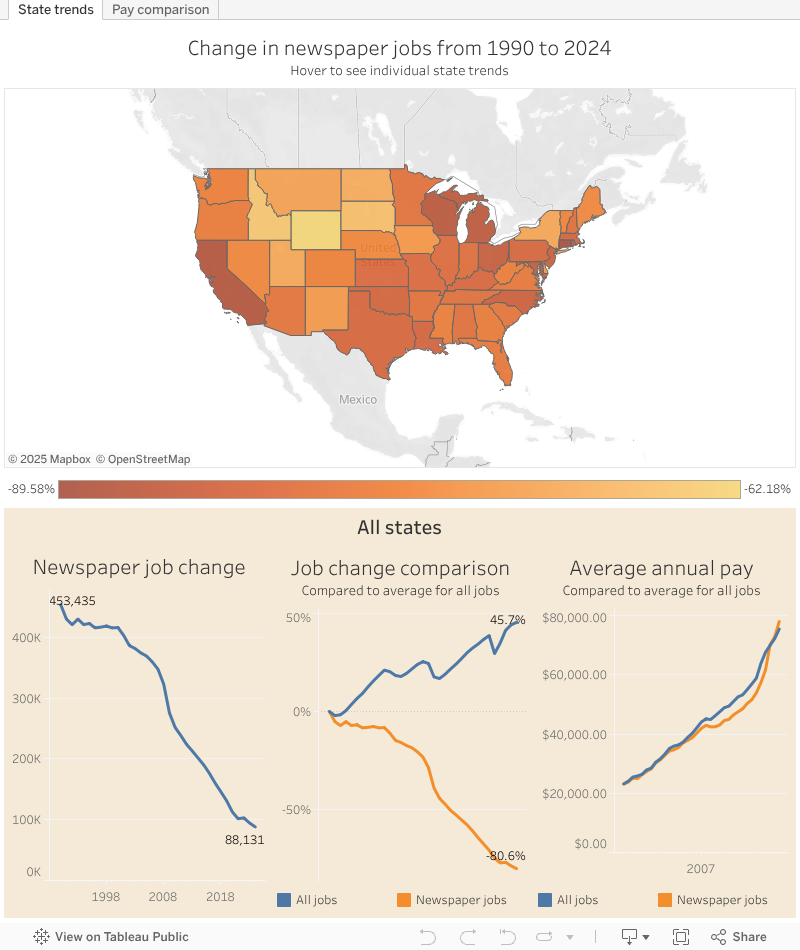
A dramatic drop in newspaper jobs
It’s not surprising that newspaper jobs have been on a steady decline, but the extent in the context of all jobs is more striking.
The map below allows you to explore these trends by individual state or region (lasso select) to see the raw change of jobs, the percentage change relative to all jobs, and the percentage change in average pay compared to all jobs.
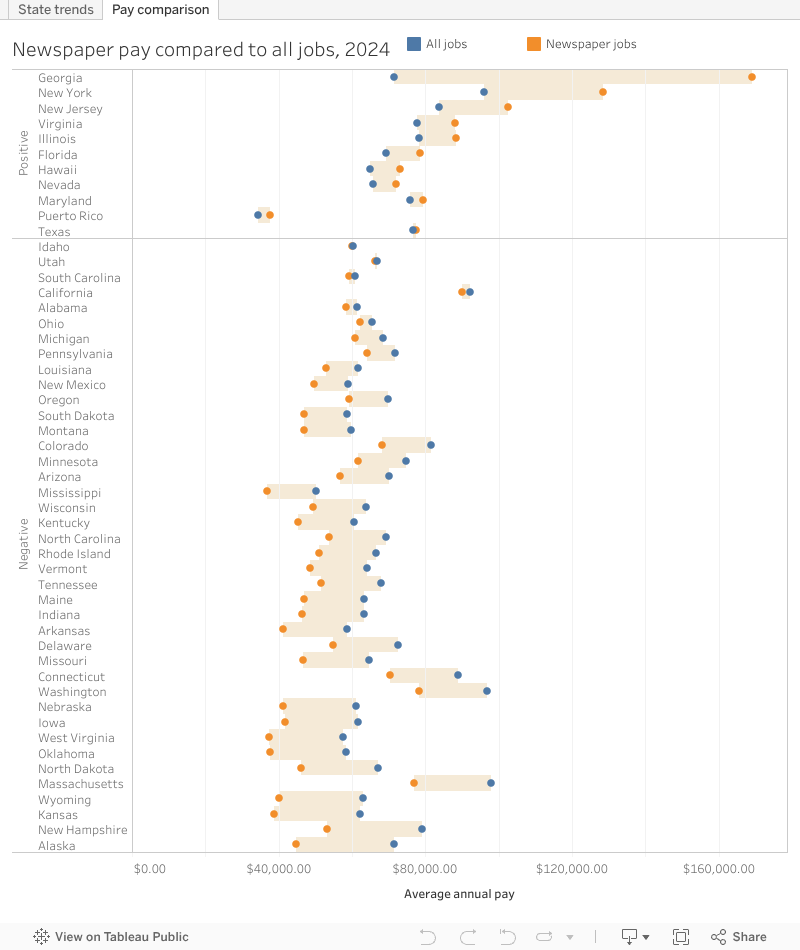
Diving more into pay, it’s interesting that there are many markets where newspaper publishing jobs do make more than the average job in the area. You could perhaps guess at most of the places where this is the case, but it does support the perception of places associated with the “media elite.”
Of course, this doesn’t include Maine or most of the country.
The Challenge: Making Government Data Accessible
The U.S. Bureau of Labor Statistics publishes rich employment data through the Quarterly Census of Employment and Wages (QCEW), but working with this data presents several challenges:
- Scale: The complete dataset is massive, requiring selective extraction
- Format: Full historical data comes in ZIP archives that need processing
- Evolution: Industry codes (NAICS) change over time, requiring careful handling
- Publishing constraints: Tableau Public has specific requirements for data source connections in workbooks
My goal was to create a pipeline that could handle these complexities while producing publication-ready visualizations showing the dramatic decline in newspaper publishing jobs from 1990 to 2024.
The Solution: A Modern Data Stack
The architecture I settled on combines three tools I’ve settled on for robust data projects running locally:
dlt (data load tool): Robust Data Extraction
dlt handles the heavy lifting of data extraction from the BLS ZIP archives. What I love about dlt is its reliability and flexibility – the same pipeline code could easily target different databases or cloud warehouses and it provides robust metadata about each load.
DuckDB: Local Analytics Powerhouse
DuckDB serves as both the analytical database and the transformation engine. Its ability to handle complex analytical queries on local data makes it perfect for this use case. As an added benefit, DuckDB databases can be attached over HTTPS, meaning that a database that others can directly access and query a DuckDB database stored alongside a project (most likely using Git Large File Storage).
dbt: Transformation with Documentation
dbt provides the transformation layer, but more importantly, it brings software engineering best practices like testing, documentation, and modular code to the analytics workflow.
Customizing dbt for Tableau Public: Schema-Based CSV Export
A key part of this pipeline is how it handles the final mile to Tableau Public. Since Tableau Public doesn’t support direct DuckDB connections, I sought a way to automatically generate CSV sources for the visualizations while maintaining the full analytical capabilities of the warehouse.
To simplify this, I created a dedicated tableau_public schema in dbt that contains models specifically designed for public consumption. This separation serves several purposes:
- Clean interfaces: Public-facing models can be simplified and optimized for visualization
- Security: Sensitive or incomplete data stays in other schemas
- Performance: Export only what’s needed for the dashboards
- Flexibility: The main warehouse can contain much more complex transformations
Automated CSV Export with Post-Hooks
The magic happens in the dbt_project.yml configuration:
models:
  newspaper_jobs:
    tableau_public:
      +materialized: view
      +post-hook: "COPY (SELECT * FROM {{ this }}) TO '{{ env_var('DBT_PROJECT_DIR') }}/tableau_public/{{ this.name }}.csv' (HEADER, DELIMITER ',')"
This configuration automatically exports every model in the tableau_public schema to a CSV file after it’s built. The post-hook runs a DuckDB COPY command that:
- Exports the complete model results
- Includes headers for easy Tableau consumption
- Places files in a predictable location
- Maintains the same naming convention as the dbt models
Why This Pattern Works
This approach solves several problems I’ve encountered in analytics projects:
1. Best of Both Worlds
You get the full power of a modern data warehouse for development and exploration, plus the accessibility of CSV files for tools like Tableau Public that have connection limitations.
2. Reproducible Publishing
Every time you run dbt run, your public-facing datasets are automatically refreshed. No more manual exports or stale data in dashboards.
3. Scalable Architecture
This pattern works whether you’re building a simple dashboard or a comprehensive analytics platform. Additional schemas can serve different purposes (internal reporting, data science, etc.) while the tableau_public schema remains focused on public consumption.
4. Version Control for Visualizations
Since the CSV files are generated automatically and can be committed to git, you have a complete audit trail of what data was used in each version of your visualizations.
Implementation Tips
If you’re building something similar, here are key considerations:
Database Choice
DuckDB excels for local analytics, but this same pattern works with PostgreSQL, BigQuery, or Snowflake. The post-hook syntax would need adjustment for different SQL dialects.
File Organization
I recommend a clear folder structure:
project/
├── dbt_models/
│   ├── staging/
│   ├── marts/
│   └── tableau_public/
├── tableau_public/           # Auto-generated CSVs
└── visualizations/          # Tableau workbooks
Beyond This Use Case
While this example focuses on employment data and Tableau Public, the pattern generalizes well:
- Academic research: Export cleaned datasets alongside analysis code
- Client deliverables: Automated report generation with data exports
- Multi-tool workflows: Bridge different analytics tools with standardized outputs
- Data sharing: Create public datasets while maintaining private analytical capabilities
Conclusion
Modern data tools have made it possible to maintain rigorous engineering practices while still producing accessible, public-facing analytics. By combining dlt’s extraction capabilities, dbt’s transformation framework, and DuckDB’s analytical power with a schema-based export strategy, you can build pipelines that serve both internal analytics teams and public visualization needs.
The key insight is treating your public-facing data as a product with its own schema, transformations, and quality requirements, rather than an afterthought export from your main analytical work.
The complete pipeline code and Tableau workbooks are available at github.com/darrenfishell/newspaper-jobs.